Grande Prairie

Riding (federal electoral district) · Statistics Canada / Elections Canada code 48026 · Alberta

View on the map →

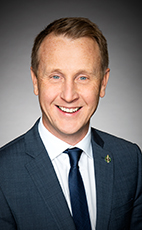
Current Member of Parliament

Representation history

No earlier terms are on record for this district. Our source, OpenParliament, publishes membership spans per member rather than per riding, so history here covers earlier terms served by the sitting member.

Census profile

Statistics Canada, 2021 Census (2023 boundaries)
Population
112,905
2021 count
Median household income
$102,000
2020 total income

Age and households

Median age35.6
Average age36.3
Average household size2.6
Aged 0–1422.3%
Aged 15–6466.3%
Aged 65 and over11.4%
Aged 85 and over1.2%

Income and low income (2020)

Median household income$102,000
Average household income$115,800
Median individual income$48,000
Low income (LIM-AT)8.6%
Low income (LICO-AT)3.0%

Two official ways of counting how many people here live on a low income after tax. They use different cut-offs, so the two figures differ.

Labour force (residents aged 15+)

Employment rate64.3%
Unemployment rate11.3%
Share of adults working or looking for work (participation rate)72.6%

Education (aged 15+)

No certificate, diploma or degree21.1%
High school diploma or equivalent32.9%
Any postsecondary credential46.0%
Bachelor's degree or higher13.2%

Housing

Owner households73.4%
Renter households25.3%
Owners spending 30%+ of income on shelter15.3%
Renters spending 30%+ of income on shelter32.7%
Owners in core housing need6.9%
Renters in core housing need21.3%

Core housing need means a home that is too expensive, too crowded or in poor repair, and the household could not afford a suitable one nearby.

Median monthly shelter cost (owned)$1,720
Median monthly shelter cost (rented)$1,340
Median dwelling value$340,000

Dwelling types

Single-detached house69.7%
Semi-detached house4.7%
Row house3.1%
Apartment in a duplex3.0%
Apartment, fewer than five storeys11.3%
Apartment, five storeys or more0.4%

Language

Knows English only93.5%
Knows French only0.1%
Knows both official languages6.0%
Knows neither official language0.4%
Mother tongue English85.8%
Mother tongue French1.8%
Mother tongue neither English nor French10.2%

Immigration and Indigenous identity

Immigrants9.7%
Immigrants who arrived 2016–20212.6%
Non-permanent residents1.0%
Indigenous identity12.4%

Getting to work

Car, truck or van94.4%
Public transit1.0%
Walking2.6%
Bicycle0.5%

Figures come from the 2021 Census of Population (income figures are for 2020), published by Statistics Canada for today’s 343 ridings (the 2023 boundaries) — the same boundaries shown here, so these are 2021 counts totted up for the ridings we use now. Statistics Canada deliberately nudges small counts up or down so no individual can be identified (random rounding) and withholds some figures entirely, so values are approximate and the parts may not add up to the total; a blank means the figure is not published for this riding. The “participation rate” here describes local residents aged 15 and over who are working or looking for work, and has nothing to do with an MP’s voting participation. Land area and population density are not published for ridings, so they are not shown.

Election results

Elections Canada, Official Voting Results